| Oracle® Enterprise Manager System Monitoring Plug-in for Oracle TimesTen In-Memory Database User's Guide Release 12.1.0.2.0 E28645-04 |
|
|
View PDF |
| Oracle® Enterprise Manager System Monitoring Plug-in for Oracle TimesTen In-Memory Database User's Guide Release 12.1.0.2.0 E28645-04 |
|
|
View PDF |
The TimesTen plug-in collects many metrics that are useful in troubleshooting performance issues. The TimesTen target page displays a collective view of your database and the performance of your database.
This chapter details the procedure for navigating to the TimesTen target page and provides an overview of the TimesTen target page.
Topics include:
To navigate to the TimesTen target page:
From the Targets menu, select All Targets on the Enterprise Manager Cloud Control 12c home page.
The All Targets page displays. Locate the Refine Search panel under All Targets.
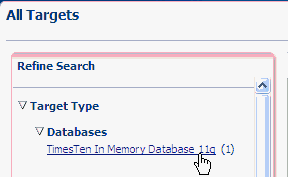
Expand Target Type, then Databases and click TimesTen In Memory Database 11g.
Figure 2-1 Choose TimesTen In Memory Database 11g

The target table displays. For each row in the table, confirm the column Target Type contains TimesTen In Memory Database 11g. The number of rows is dependent on the number of TimesTen targets you have configured. For example, if you configured two TimesTen targets, then you should see two rows in the table. For each row, the Target Type equals TimesTen In Memory Database 11g.
In the column Target Name, identify the TimesTen target you wish to review, and click the Target Name. The target name is the name of the TimesTen target you configured.
The TimesTen target page displays.
The TimesTen target page allows you to gather monitoring and metrics information specific to TimesTen targets. Figure 2-3, "TimesTen target page" shows Enterprise Manager Cloud Control menu choices as well as menu choices that have been customized for TimesTen targets.
A description of the menu choices that have been customized for TimesTen targets follows:
Home
Displays high level performance metrics and configuration data. For more information, see Chapter 3, "Working with the TimesTen Home Page."
Monitoring - All Metrics
Displays metric information in table format. For more information, see Chapter 6, "Viewing Metrics."
Information Publisher Reports
Displays reports about your TimesTen database. For more information, see Chapter 8, "Viewing Reports."
Performance
Displays performance metrics in graphical format. For more information, see Chapter 4, "Working with the Performance Page."
Additional Links - Cache Synchronization Metrics
Displays cache synchronization metrics. For more information, see Chapter 5, "Working with the Cache Synchronization Metrics."
Additional Links - Replication Monitor
Displays information for monitoring replication. For more information, see Chapter 7, "Working with the Replication Monitor."