| Oracle® Enterprise Manager System Monitoring Plug-in for Oracle TimesTen In-Memory Database User's Guide Release 12.1.0.2.0 E28645-04 |
|
|
View PDF |
| Oracle® Enterprise Manager System Monitoring Plug-in for Oracle TimesTen In-Memory Database User's Guide Release 12.1.0.2.0 E28645-04 |
|
|
View PDF |
This chapter describes the Cache Synchronization Metrics page.
Topics include:
The cache synchronization metrics shows cache specific performance information. In order to view the metrics, make sure you have configured a cache environment for your TimesTen target and make sure the cache agent is up.
To view the cache synchronization metrics, make sure you are on the TimesTen target page. For information on navigating to the TimesTen target page, see "Navigating to the TimesTen target page".
From the TimesTen IMDB menu, select Additional Links, then select Cache synchronization metrics.
The TimesTen cache synchronization metrics page consists of two panes each of which have been customized for TimesTen cache environments. The left pane shows cache related performance data that is derived from values in the SYS.SYSTEMSTATS system table. For more information, see "SYS.SYSTEMSTATS" in the Oracle TimesTen In-Memory Database System Tables and Views Reference. The right pane shows cache related performance data represented in graphical format.
The left pane consists of:
The right pane consists of the following graphs:
The cache autorefresh region shows the number of rows deleted, inserted, and updated in TimesTen from the Oracle DB. The number of cycles that completed successfully and the number of cycles that failed on TimesTen are also displayed.
Click the arrow to the left of Cache AWT to expand the Cache AWT region.
The cache AWT region shows the number of transactions committed on the Oracle database and the number of transactions rolled back on the Oracle database. The number of batches sent, bytes sent, rows deleted, rows inserted, and rows updated on the Oracle database for method 0 and method 1 of AWT cache are also displayed.
The method determines whether the PL/SQL execution method or the SQL array execution method is used to apply changes to the Oracle database server for Asynchronous Writethrough propagation. Method 0 uses SQL array execution. Method 1 uses PL/SQL collections and anonymous blocks.
For more information about AWT cache methods, see "TimesTen Cache first connection attributes" in the Oracle TimesTen In-Memory Database Reference.
Click the arrow to the left of Cache SWT to expand the Cache SWT region.
The cache SWT region shows the number of bytes sent, rows deleted, rows inserted, and rows updated on the Oracle database for SWT cache.
Click the arrow to the left of Cache Flush to expand the Cache Flush region.
The cache flush region shows the number of flush cache group executions as well as the number of bytes and rows flushed to the Oracle database.
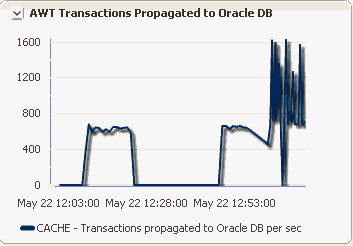
Figure 5-5 AWT transaction propagated to Oracle DB

The AWT transactions propagated to the Oracle DB region uses a line graph to show the number of AWT transactions propagated to the Oracle DB per second.
The X-Axis represents time. The Y-Axis represents the AWT transactions propagated to the Oracle DB per second.
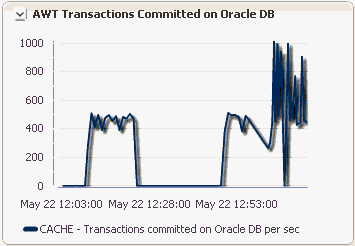
Figure 5-6 AWT transactions committed on Oracle DB

The AWT transactions committed on the Oracle DB region uses a line graph to show the number of AWT transactions committed on the Oracle DB. This region is presented on the same page as Transactions committed on TimesTen in order that you can compare transaction activity on both the Oracle DB and TimesTen.
The X-Axis represents time. The Y-Axis represents the number of AWT transactions committed on the Oracle DB per second.
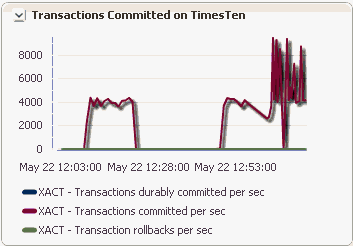
Figure 5-7 Transactions committed on TimesTen

The transactions committed on TimesTen region uses a line graph to show the number of total transactions committed on TimesTen. This region is presented on the same page as AWT transactions committed on Oracle DB in order that you can compare transaction activity on both the Oracle DB and TimesTen.
The X-Axis represents time. The Y-Axis represents the number of AWT transactions durably committed, AWT transactions committed, and AWT transaction rollbacks on TimesTen per second.
The AWT batch performance region uses a line graph to show AWT Batch performance represented as a rate of rows per batch.
The X-Axis represents time. The Y-Axis represents the rate of rows per batch in SQL mode (CacheAWTMethod=0) and PL/SQL mode (CacheAWTMethod=1).
The AWT volume per second region uses a line graph to show the AWT volume (in Megabytes) per second.
The X-Axis represents time. The Y-Axis represents total AWT volume (in megabytes) per second.