Date: Tue, 9 Jun 2015 14:29:32 +0000
Hi Alexey,
After stabilizing on 100% Success Rate in heavy load on our application we started to perform CPU Usage profiling.
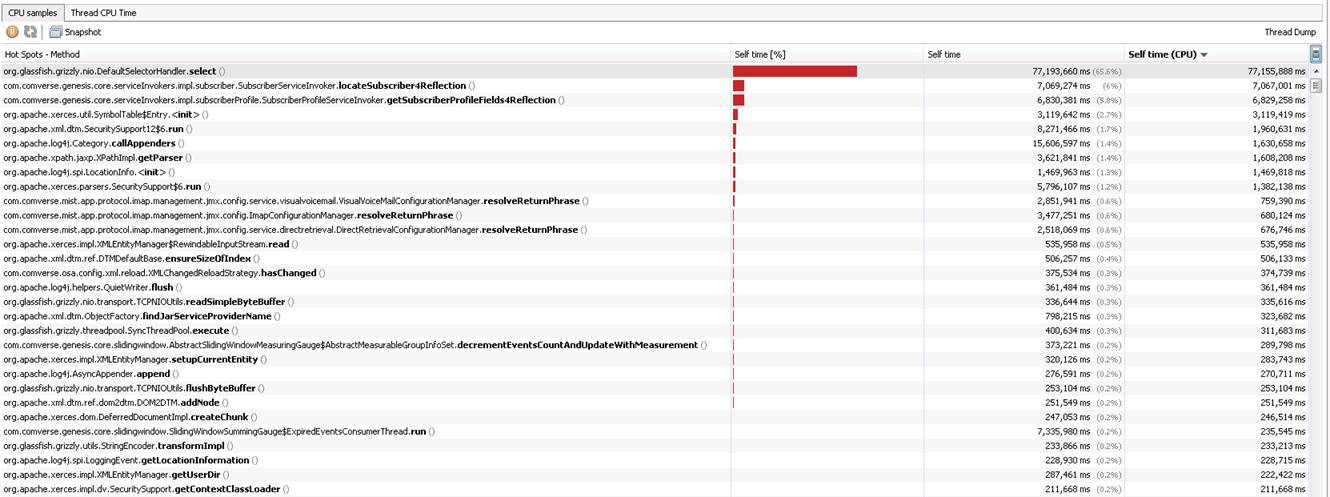
We have noticed (you can see the attached screenshot) that we are spending 66% from the CPU time in the org.glassfish.nio.DefaultSelectorHandler.select() method.
We are running the load with the following environment:
* Grizzly 2.3.21
* JDK 1.7.0_72-b14
* RHEL 5.X
Any advice on how can we improve the high CPU consumption?
[cid:image003.jpg_at_01D0A2D6.6204FEE0]
Thanks
Uri
________________________________
"This e-mail message may contain confidential, commercial or privileged information that constitutes proprietary information of Comverse Inc. or its subsidiaries. If you are not the intended recipient of this message, you are hereby notified that any review, use or distribution of this information is absolutely prohibited and we request that you delete all copies and contact us by e-mailing to: security_at_comverse.com. Thank You."

(image/jpeg attachment: image001.jpg)