Date: Wed, 10 Jun 2015 21:53:33 -0400
I forgot to mention that I see the same behaviour even if I set the number
of kernel threads=2 (=number of CPU) and use the SameThreadIOStrategy.
On Wed, Jun 10, 2015 at 9:27 PM, Parthy Chandrasekaran <
partheinstein_at_gmail.com> wrote:
> Hi,
>
> I am measuring the latency of certain types of transaction with Grizzly as
> the server and I am noticing some queuing behaviour that I don't understand.
>
> Grizzly is configured to have kernel thread pool of 10 and worker thread
> pool of 10 (probably an overkill for the type of transactions I am talking
> about). The WorkerThreadIOStrategy is used and a simple "echo" string
> filter is used to echo back received data:
>
> FilterChainBuilder filterChainBuilder =
> FilterChainBuilder.stateless();
> filterChainBuilder.add(new TransportFilter());
> filterChainBuilder.add(new StringFilter(Charset.forName("UTF-8"),
> "\n"));
> filterChainBuilder.add(new EchoMessageFilter());
>
> ThreadPoolConfig kernelThreadPoolConfig =
> ThreadPoolConfig.defaultConfig();
> kernelThreadPoolConfig.setCorePoolSize(1);
> kernelThreadPoolConfig.setMaxPoolSize(10);
>
> ThreadPoolConfig workerThreadPoolConfig =
> ThreadPoolConfig.defaultConfig();i
> workerThreadPoolConfig.setCorePoolSize(1);
> workerThreadPoolConfig.setMaxPoolSize(10);
>
> transport.setIOStrategy(WorkerThreadIOStrategy.getInstance());
> transport.setSelectorRunnersCount(10);
> transport.setKernelThreadPoolConfig(kernelThreadPoolConfig);
> transport.setWorkerThreadPoolConfig(workerThreadPoolConfig);
> transport.setProcessor(filterChainBuilder.build());
>
> The server is a VM with 2 CPU with 2GB memory.
>
> The client is in same subnet as the server with very few hops in between,
> It generates transactions at a rate. In each transaction, I establish a TCP
> connection, send a byte, receive a byte, close the connection and measure
> the duration. The arrival rate of these transaction is 10/s (fixed) and
> total time for the test is 60s. So in total there are 600 of these
> transactions.
>
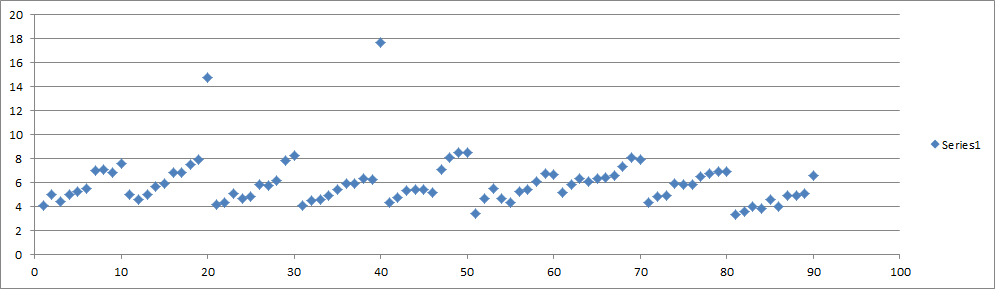
> Here is the scatter plot of the latency of the transactions for the entire
> run:
>
> [image: Inline image 1]
>
> y-axis is time in ms and x-axis are transaction number (sorted by when
> they were fired).
>
> As expected there is a initial warm period and after 1s things start to
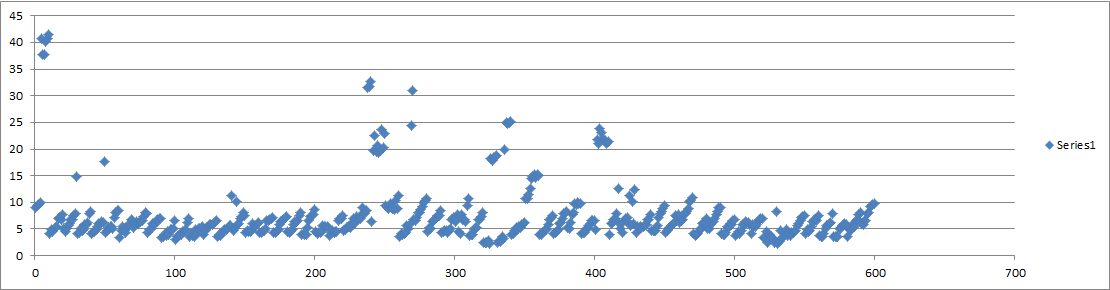
> settle down but if we zoom in to a time frame (say t=1 to t=10s), we see
> this:
>
> [image: Inline image 2]
>
> At the start of every second there are 10 new transactions but notice the
> slants!?! I would have expected more or less the same latency for all 10
> transactions but this pattern seems to indicate there is some sort of
> queuing.
>
> I don't understand the occurrence of those outliers at between 25th and
> 45th second mark.
>
> I can reproduce a similar looking scatter plots consistently.
>
> My next step is to step through in to Grizzly code. Any
> ideas/explanations? Has anyone seem this kind of pattern in the past?
>
> Thanks,
> Parthy Chandrasekaran
>
(image/png attachment: image.png)
(image/png attachment: 02-image.png)