Date: Thu, 8 Sep 2011 09:22:50 -0500 (CDT)
Hi Markus,
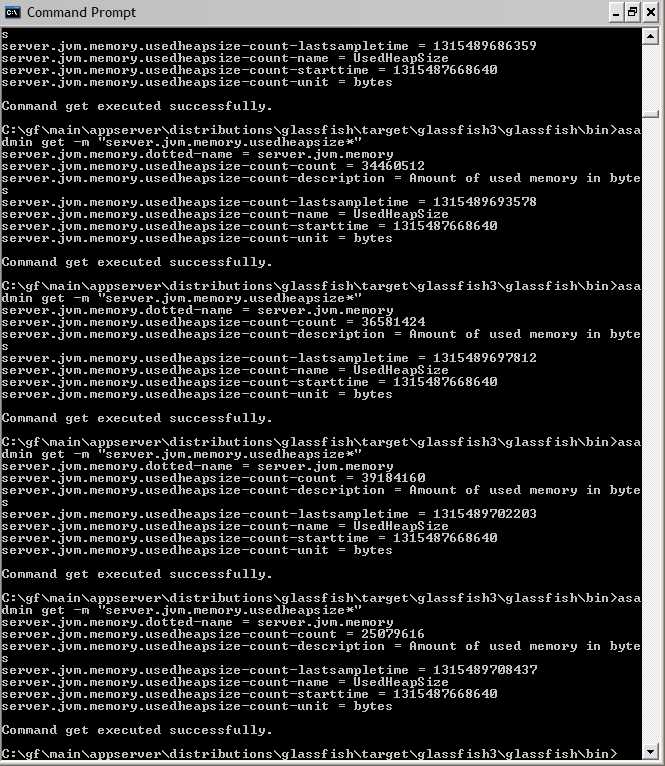
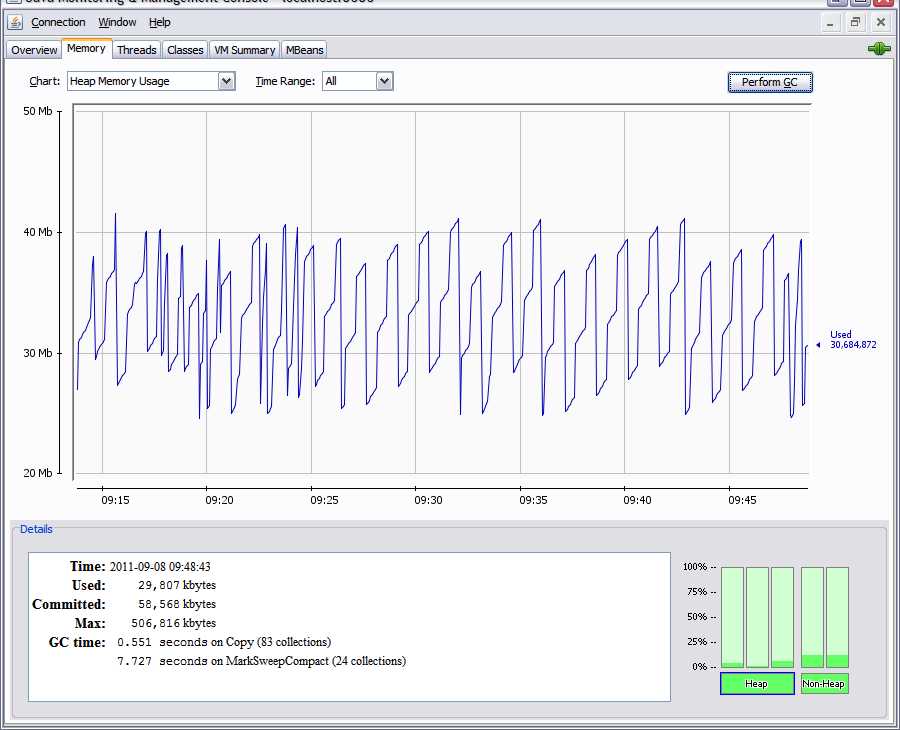
I tried to follow the Heap Memory Usage Chart in jconsole as closely as I
could, while simultaneously using asadmin get -m
"server.jvm.memory.usedheapsize*". The times were not exactly the same,
but the used heap seem to follow each other, going up and down from
30-40MB. What's shown in jconsole and asadmin will be data collected at
different times, so that could be why your values are different?
3.0.1 does have a bug which affects the memory value. This was fixed in
3.1.
http://java.net/jira/browse/GLASSFISH-12490 [1]
GlassFish gets the memory data from java, so they should be getting the same
data.
ManagementFactory.getMemoryMXBean().getHeapMemoryUsage().getUsed()
Thanks,
Jennifer
[1] http://java.net/jira/browse/GLASSFISH-12490
--
[Message sent by forum member 'jc129909']
View Post: http://forums.java.net/node/840593
(image/jpeg attachment: asadminmonitor.jpg)
(image/jpeg attachment: jconsole.jpg)