Date: Thu, 6 Mar 2008 01:39:46 +0100
Hi there,
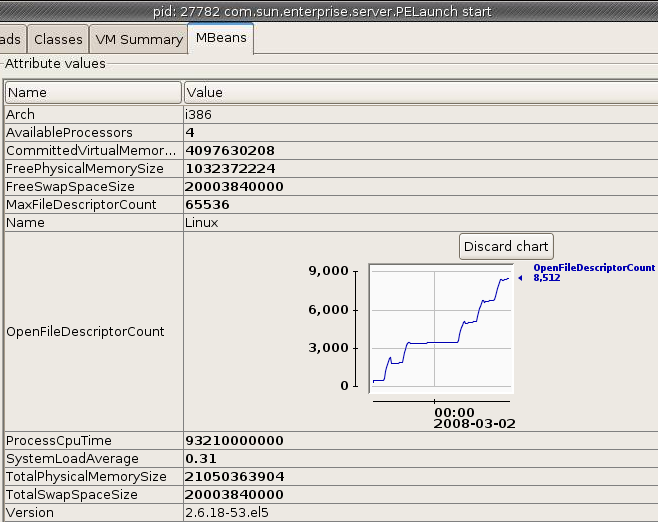
have a look at the picture I've attached. It is showing GFv2UR1 in our
customer's production environment running our application (EJB3
local+remote and Swing client).
The chart starts on Thursday morning and goes up, then just after 5pm,
when remote clients disconnects (people go home) it goes down a little
bit, during night it is stable, then it grows again during Friday up
until somewhere 5pm. Then weekend begins and line is almost completely
horizontal until Monday morning... as you can see during this week
everything looks pretty much the same.
I am not sure, but it looks like some kind of leak. I was reporting
similar behavior about year ago against GFv2 beta, but I wanted to
confirm it is still happening in final build. It is much better than
in beta, but still it does not look good.
The problem is I cannot reproduce this issue in testing environment.
There are about 150 users using our application deployed on that
production server.
Maybe someone from Glassfish team have some idea what it could be?
Thanks,
Witold Szczerba

(image/png attachment: gfv2ur1-leak.png)