Graphical Status Meter (GSM)
Last Updated 4.16.02
General Description
The Graphical Status Meter (GSM) is a visual representation (graphic) used to describe
state information for the purpose of monitoring a metric, system or business
process. It conveys information about the distribution of data (e.g. value of
a metric threshold or status of an order). It can represent a roll up of a multi-step
business process or a single type of information (e.g. of a file system). Multiple
GSMs can be used for applications that need to express summary information for
multiple objects. When multiple GSMs are presented on a screen they can help
the viewer to see patterns and possibly make correlations of quantitative data
either at a single point in time or, if the UI allows, view historical data
over a selected time period. The GSMs compact design can be utilized in UIs
requiring high information density.
Note: The graphical status meter is an image that will be generated by BI Beans technology.
Guideline Attributes
Spec Version # - 3.1
Spec Author - Michelle Bacigalupi
Designers - Michelle Bacigalupi, Alex Sorin
Contributors - Ivy Leung, Carmen D'Arlach, Betsy Beier
UI Models - all models
Example Products - Enterprise Manager - Thinclient, Chain Exchange,
Supply Chain, KPI indicators Business Intelligence
Related Guidelines - Table guideline, Graph
guideline, Icon Icons
Repository: Status Indicator Icons, Color
Palette Guideline
Interaction and Usage Specifications
General Principles
The Graphical Status Meter, a generated graphic, visually represents the current state of usage, with
optional features noting thresholds (e.g. OK, warning and critical). These thresholds
could represent, for example, minimum and maximum order fulfillment levels;
severity levels of a metric; or under, within, and over projected budget levels.
Threshold features can also be used in conjunction with threshold controls.
These thresholds can be set as a function of product installation and configuration.
Threshold controls can also be articulated and set apart from the GSM by an
end user during use of the product. If there is a need to compare the status
of multiple objects/processes or there are several objects to surface multiple
GSM's are to be used and they should be placed within the cells of a standard
BLAF table with associated columns of specific numeric values that correlate
to the GSM. It can also be used as a label value pair if there are only a few
items. However, it is recommended that the specific numeric value is also included
as well.
This meter is made up of three graphical elements. They include:
- Background - either gray or, when used in conjunction with threshold information,made
of green, yellow, red, and white areas to indicate OK, Warning and Critical
levels
- Databar - made of a color fill
- Numeric Values under component with unit ticks or min/max indicators (optional)

The following are examples of the Graphical Status Meter, from simplest to
complex.
1A & B) Basic GSM: Indicates current value, percent of usage or
percent completion (e.g. filesystem or of a Key Performance Indicator)
Product examples: - Projects - denoting completion of tasks, CRM, BIS, OEM Administration
Framework, ERP, Oracle Sourcing
1C & 1D) Basic Meter with Value Setting: In some cases it may be
appropriate to associate the basic GSM with a text field where the users can
enter exact values for different attributes. The GSM gets updated once the user
selected "Set Values." Each attribute has an associated GSM.
Product examples: Sourcing: Multi-Attribute scoring and weighted bid ranking
 |
 |
 |
 |
| 1A. Basic GSM |
1B. Basic GSM with numeric tick scale |
1C..Basic GSM with Value Setting |
1D. Basic GSM with Numeric Value
(Read Only) |
Components used:
- Data Bar - default to blue for homogeneous information. Can be various BLAF
colors if heterogeneous information.
- Background with gray value
- Numeric tick scale (optional)
2) Threshold w/ Indicators: Indicates OK, Warning or Critical
thresholds of metrics (background), and current status against those values
(databar.)
Product examples: Metrics in OEM Administration Framework, Balance Scorecard
 |
 |
|
| 2A. Threshold Meter |
2B. Threshold Meter with numeric scale |
Components used:
- Data Bar - default to gray
- Background with green, red and yellow
- Numeric tick scale (optional
Scenarios
1) Basic Graphical Status Meter
2) Basic Graphical Status Meter with Value Setting
3) Threshold Meter with Severity Indicators
Basic Graphical Status Meter
This is used when simple indicators of percentage are required to show current
value or status of usage. It can also be used to display availability.
- Context of Use
- The Basic GSM's to be used within a table cell if there are multiple
items or as part of a label value pair if there is only one data point
- If the table consists of homogeneous information the Data Bar should
be the same color (e.g. filesystem usage)
- If the table consists of heterogeneous information of a category type
(e.g. Different business processes) the color for the different processes
should be the same throughout each user session. (See option 2)
- If used in a table, a status icon should also be used in association
with each GSM.
- If used in a table a numeric value (e.g. under the "Current"
column header in the table below) is associated with each GSM.
- Colors are to be chosen from the BLAF color palette.
- Optional
- Different subcategorizes can be displayed in one table as in Option
2 below
- Prohibited
- There is no drilldown from the GSM.
- No threshold indicators are to be used as this is not a measure of
a metric
Example scenarios of use
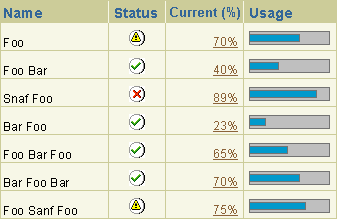
Option 1 - Basic GSM's appear within a table to indicate how much of a file
system out of 100% is used The Basic GSM is used here with other displays in
the table such as the status icons and the numeric value of the the Graphical
Status Indicator.
Basic GSM - Homogeneous Data Type (Use same color)
 |
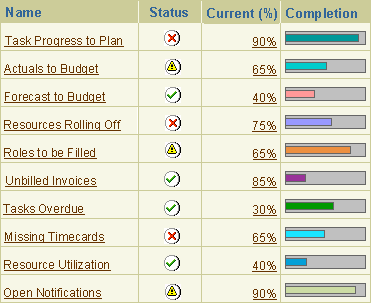
Option 2 - The Graphical Status Meter indicates how much, out of a 100%, has
been completed for a given business process. (E.g. Budget, Forecast, Requirements).
It represents what percentage of the process is complete via the basic version
of the GSM with different colors for each type or process and is displayed with
a status indicator and an associated numeric value.
Basic GSM - Heterogeneous Data Type (Use same colors)
 |
Basic GSM with Value Setting
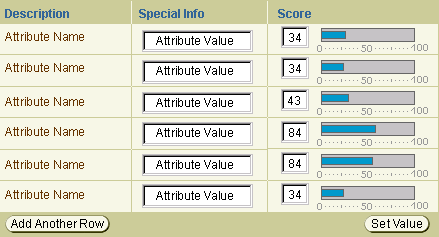
This version of the component can be used to assign a score to different possible
attributes. Each score assigned to an item attribute is a number that represents
the value of that attribute compared to other attributes.
- Context of Use
- This component is to be used within a table cell
- Numeric tick labels from 0-100 are needed
- There is an input field associated with each GSM to set a value for
each attribute coupled with an Apply button
Example scenarios of use
An Auction/RFQ creator will assign values to item attributes. Each value assigned
to an item attribute represents the importance of that item attribute relative
to other item attributes.
Value Setting
Basic GSM with Value Setting Plus Read Only
- Context of Use
- This component is to be used within a table cell
Example scenarios of use
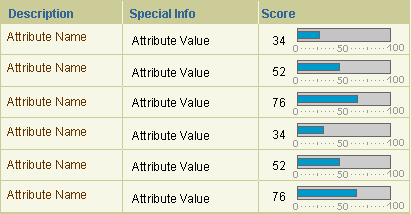
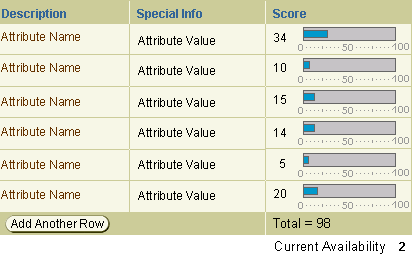
The view only version will be used by a bidder/supplier to bid/quote for the
highest score expected by the Auction creator.
Value Display -Read Only
 |
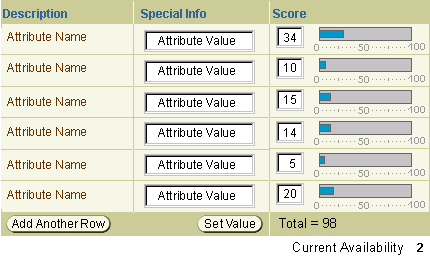
Basic GSM with Value Setting and Dependencies
- Context of Use
- This component is to be used within a table cell
- There are numeric tick labels
- A Recalculate button is associated to update availability.
Example scenario of use A user would set the value of each attribute according
to the importance. The total score can not exceed a 100 hence the dependencies
of attributes on each other.
Value Setting with Dependencies - Updatable
 |
Basic GSM with Value Setting and Dependencies Plus
Read Only
Value Setting with Dependencies - Read Only
 |
Threshold Meter with
Severity Indicators
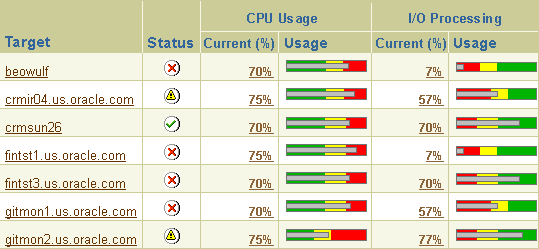
The Threshold GSM is used when a threshold is set for a specific metric. The
Threshold GSM indicates the current state of the metric.
- Context of Use
- When multiple objects are displayed this component is to be used within
a table cell. When only a signal data point is required it can be part
of a label/value pair
- Threshold ranges to indicate OK, Warning and Critical must be displayed.
- Thresholds have been set in another part of the UI or come as system
defaults are required to be displayed
- If used in a table, a status icon should also be used in association
with each GSM in a different column.
- If used in a table a numeric value (e.g. under the "Current"
column header in the table below) is associated with each GSM
Example scenarios of use
An administrator sets the thresholds for CPU Usage and I/O Processing metrics
for targets A,B, C, etc. She sets the warning and critical levels on a per target
basis. The Graphical Status Indicator below shows the state of the target with
regards to the metrics.
Thresholds with severity indicators
 |
Threshold Meter with Numeric Tick Values
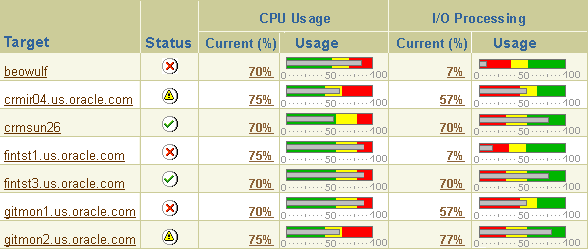
The Threshold GSM with severity and numeric tick labels is to be used when
thresholds are set that have values which can be associated a numeric range
of 0-100.
-
Context of Use
- When multiple objects are displayed this component is to be used within
a table cell. When only a signal data point is required it can be part
of a label/value pair
- Threshold ranges to indicate OK, warning and critical thresholds are
needed
- Thresholds have been set in another part of the UI or come as system
defaults
- If used in a table, a status icon should also be used in association
with each GSM in a different column.
- If used in a table a numeric value (e.g. under the "Current"
column header in the table below) is associated with each GSM.
Thresholds with numeric tick values
 |
Visual Specifications
Visual Definitions
When precise values are needed, graphs should be supplemented with other
displays, such as tables and crosstabs. Graph color should be consistent for
each on per session and for each item type. Color should also be used as a secondary
indicator.
- All text should be BLAF compliant
- all text size/color/style used, spacing within component, spacing relative
to other components, min/max cases, etc.
Component Measurements
Details to come...
Open/Closed Issues
Open Issues
03.23.02 - v3.0+ - A version of weight setting with a slider bar is under investigation
for the future with the development of cross browser supported drag and drop
technology.
03.23.02 - Whether to have the associated numeric values within the same
table cell or in a separate cell.


